Open Activity Monitor, choose the Network tab, and sort by Sent
Bytes or Rcvd Bytes to find busy processes. For live destinations
use nettop. If you need retained app-level
destinations plus Allow or Block decisions, use a per-app network
monitor or outbound firewall.
Use Activity Monitor for a fast first look
- Open Activity Monitor from Applications → Utilities or with Spotlight.
- Select the Network tab.
- Sort by Sent Bytes, Rcvd Bytes, Sent Packets, or Rcvd Packets.
- Search for the app name, but remember that network work may appear under a helper process with a different name.
Activity Monitor is ideal for answering “which process has transferred the most data?” Apple’s Activity Monitor guide explains the built-in process views.
Its limitation is intent. A byte count does not tell you whether the destination was an update server, a tracker, a local device, a peer, or a service required by the app.
Use Terminal for live connections
nettop
Run nettop to see processes and their live network
flows. It is useful when you need a process name, remote address,
protocol, and current traffic together. Press q to
exit. Filtering options are available through
man nettop.
lsof
lsof -i -n -P lists open internet sockets without
resolving names. This is a snapshot, so a short-lived connection can
open and close between commands.
Packet capture
tcpdump can capture packets by interface, host, and
port. It is excellent for protocol investigation, but mapping every
packet back to the responsible app—and deciding what to do
next—takes more work.
A visible app can launch XPC services, command-line tools, or differently signed helpers. A useful app-level monitor needs a defensible attribution model instead of grouping solely by a display name or reused PID.
What to look for beyond bandwidth totals
- Destination: hostname or IP address, port, and whether it is local or remote.
- Transport: TCP, UDP, DNS, or QUIC can have different decision semantics.
- Timing: did the app connect at launch, after a click, or while idle?
- Attribution: was the flow made by the main app, a child, or an unrelated process?
- Decision: was the flow allowed, denied, or admitted by a specific rule?
- History: can you reproduce the behavior after quitting and relaunching?
Monitor one app with Faraday Cage
Faraday starts from a selected application rather than a whole-Mac stream. Add the app to a Cage, choose its default policy, restart it, and reproduce the action you are investigating. The dashboard groups observed activity by destination and keeps each decision next to the evidence that produced it.
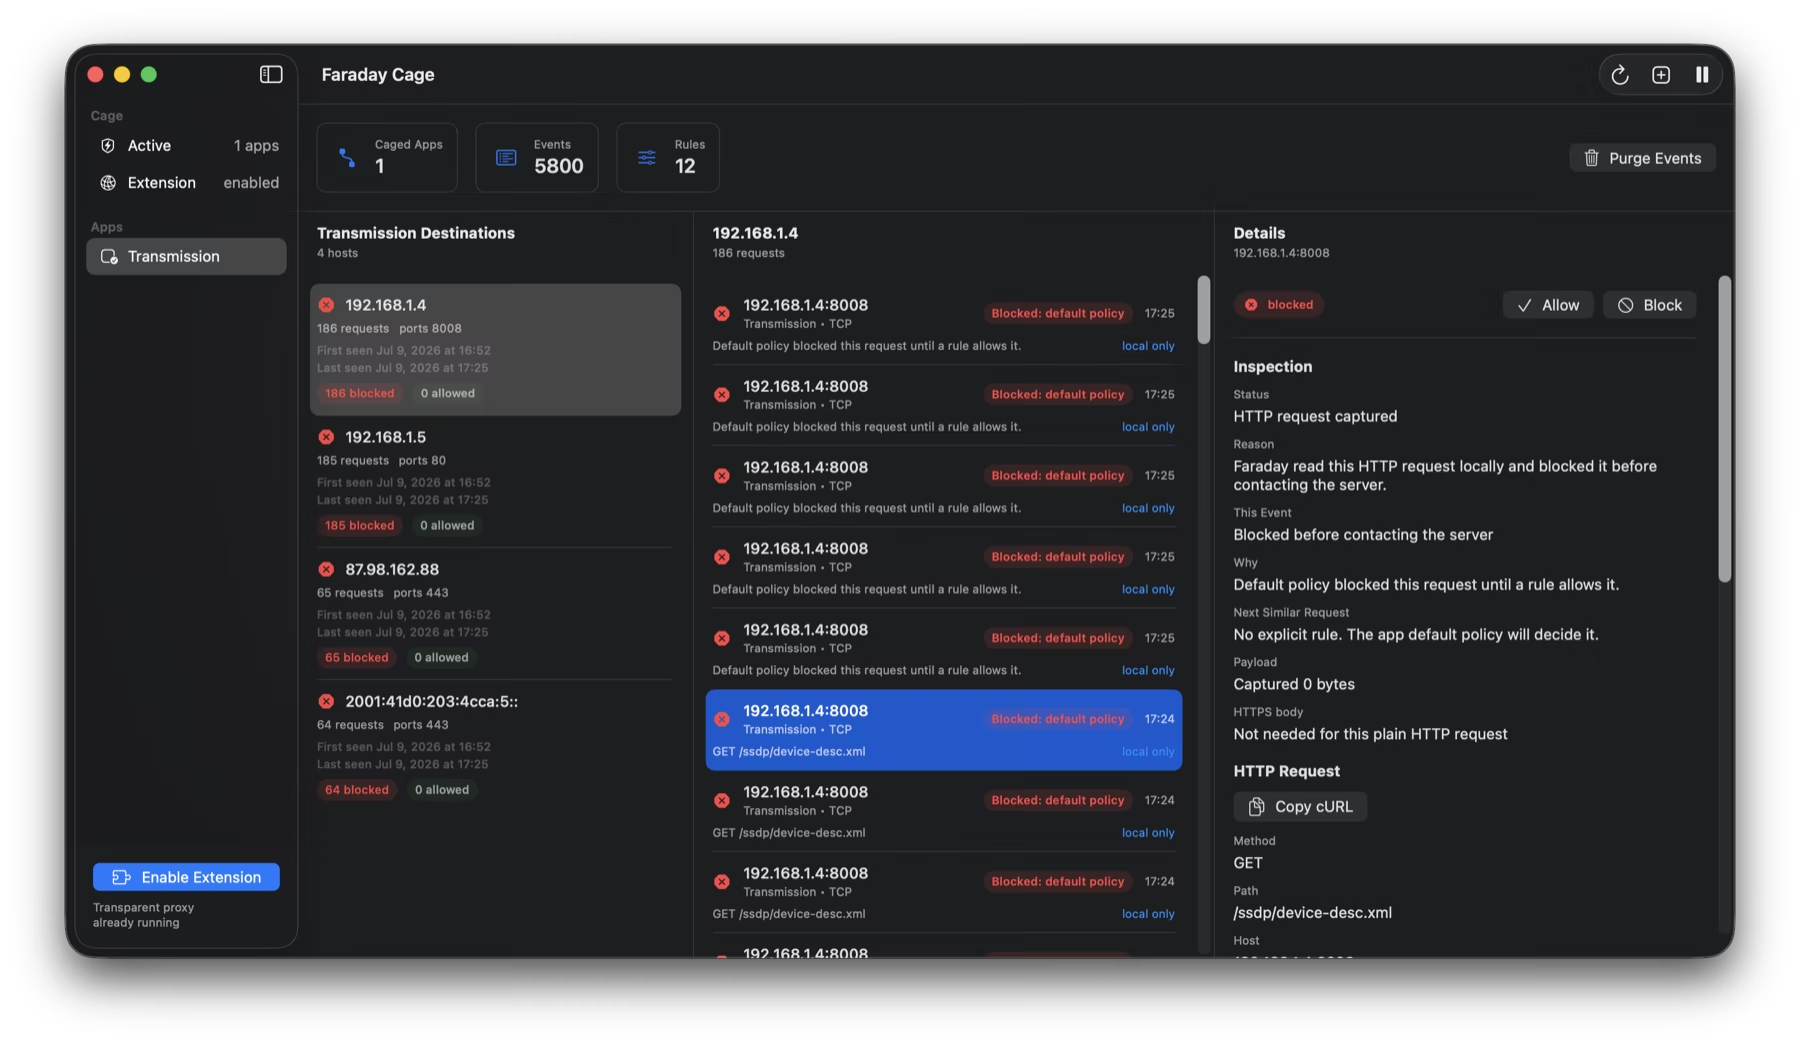
From an event, you can create a narrow Allow or Block rule rather than treating the entire application as trusted or untrusted. The product does not upload destinations for analytics or cloud enrichment.
How to interpret what you find
A connection is evidence, not a verdict. Update checks, content delivery, authentication, crash reporting, ads, telemetry, LAN discovery, and user-requested sync can all look like “the app went online.” Before blocking a destination:
- repeat the action and see whether the destination appears consistently;
- block narrowly and test which visible feature breaks;
- keep a way to reverse the rule;
- avoid assuming an IP address belongs permanently to one company;
- treat encrypted payloads honestly—the destination may be visible even when content is not.
Turn network evidence into a local policy.
Request access to the Faraday Cage private beta.
Request early access ↗